


It’s the time of the season for adjusting
When GDP runs high.

The June quarter GDP figures will be released on Thursday. For the first time in a long time, I don’t have a feel for what the number will be. I see that the main banks, the Treasury and the RBNZ are all forecasting growth of between 0.4% and 0.8%, and as I noted recently, high-frequency indicators also suggest some decent growth for the quarter.
That might not seem to fit with the current vibe; I certainly can’t think of anything to suggest that the economy gained a second wind in that period. But even without knowing anything about the state of the economy, there’s good reason to think that we’ll see a solidly positive number, and/or that the ‘technical recession’ will be revised away. And that has to do with something that economists often cite without explaining what it means: seasonal adjustment.
The idea behind it is simple enough. The economy waxes and wanes over the course of the year, sometimes for fairly obvious reasons; for instance, retail spending is much higher in December than in any other month. When we talk about how the economy is tracking, we don’t want to be fooled by things that can be foreseen just by looking at a calendar. Instead, we’d like to strip out these regularities and look at how the data is performing compared to ‘normal’ for that time of year.
How that’s done in practice is something of a black box though. There is a commonly used procedure, but even then, different users can get different results depending on how they set some of the parameters. (The example that comes to mind is the monthly REINZ house sales - next time, keep an eye on who reports what number.)
In terms of how it works, this page on the Stats NZ website goes into much more detail; I’m just going to go into the aspects of it that I think are currently affecting the GDP figures.
Any time series data can be broken down into three components:
Actual = T + S + I
T is the trend component, which describes how the data evolves over the history of the data series. S is the seasonal factor, describing how the data behaves within the course of a year. If you plot it on a chart, it will typically have a sawtooth pattern. And I is the irregular element; on a chart it will look jagged and ‘noisy’.
When we talk about seasonally adjusted data, what we’re doing is estimating S, removing it, and reporting T + I, the trend plus the noisy part. To do this, we tell the program to estimate the three components, with some rules about how we’d like each of them to behave:
The trend T should evolve smoothly from one period to the next, and should capture the cycles that can play out over years or decades.
The seasonal factors S should be fairly consistent - either they’re fixed over history or, more commonly, they’re allowed to evolve only slowly over time. If the seasonal factors have changed direction after just a few years, you can’t really call them seasonal.
The irregular component I should look random. In practice it won’t be, because economic data is hardly ever random. But at the least it should have zero correlation with the other two components.
Then the program goes to work, trying to balance all of those criteria as best it can. It won’t be able to satisfy all of them at once though, and if you tweak the program’s parameters it will make different trade-offs to give different results.
Every time we get a new data point, such as the latest quarter of GDP, the seasonal adjustment program is run again, using the entire history of the data. That new bit of information will affect how the program apportions between T, S and I, especially for the most recent few years. It doesn’t usually have a big effect, but it’s one reason why we normally see revisions to previous results whenever there’s a new release.
All of this works best when you’re dealing with data that behaves in a consistent way over time. But when something weird happens, you have to start making compromises.
Take for example the 10% or so plunge in GDP in the June 2020 quarter during the Covid lockdown - something like a ten standard deviation movement. How would the seasonal adjustment program handle this? It should, rightly, allocate most of it to the irregular component. But a bit of it will also go into the trend, and some will go into the seasonal factor. What’s more, the ‘evolve slowly’ requirement for the seasonal factor means that this freak event will exert a gravitational pull on the surrounding periods, dragging down the estimated seasonal factors for June 2019, June 2021, and so on as well.
The simple fix for this is to tell the program to treat June 2020 as an outlier and exclude it (or rather, give it zero weight) in the calculations. That’s safe enough to do if you can be confident that it was a one-off before normal transmission resumed (and remember that at the time it was far from clear that that would be the case).
It’s a different story if you’re faced with an abrupt, long-lasting change in how the data behaves. And that’s what happened with the other major Covid impact: the effective closure of the border and the loss of the international tourism market.
Tourism accounts for a lot of the seasonality in New Zealand’s GDP - the net inflows peak in summer (December and March quarters) then cool off in winter (June and September quarters). In a way you could say that the New Zealand economy goes into recession every year - that winter drop-off in income and jobs is real, not a quirk of the data. But it isn’t a ‘problem’ that would require a response from policymakers.
The border closure in March 2020 immediately removed that seasonal pattern, and that remained the case for a couple of years. Even now, visitor numbers are only back to around 80% of pre-Covid levels (and spending will be even lower than that, because higher-spending markets have been slower to revive).
If you run the seasonal adjustment as normal, the ‘evolve slowly’ requirement means that it will be slow to pick up on the fact that the old pattern has disappeared. for at least a few years, it will continue to produce large negative seasonal factors in winter and positive ones in summer. Or to put it another way, it will unnecessarily pull up the seasonally adjusted series in winter and push it down in summer.
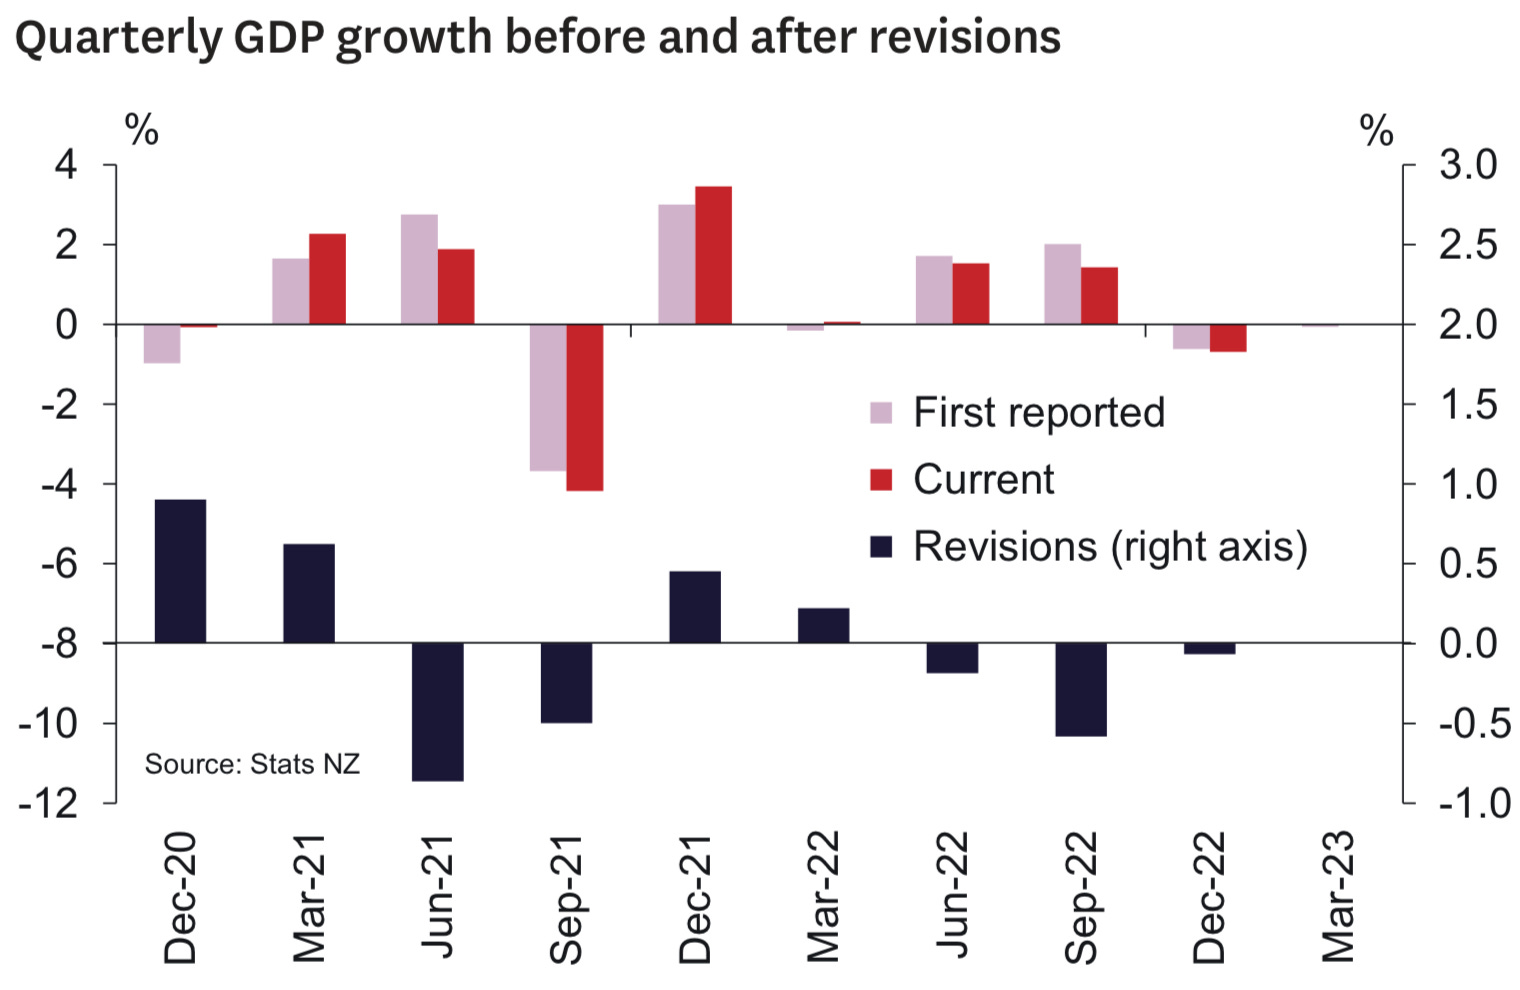
We can see this in the quarterly GDP growth figures. The December 2020 quarter, the first summer without overseas tourists, was initially recorded as a 1% drop. The March 2021 quarter recovered somewhat, but June 2021 saw a whopping 2.8% rise. The next two quarters were affected by the second major Covid lockdown, but then we move on to March 2022 (a summer quarter), where GDP fell by 0.2%. Then we had June and September - yep, winter quarters again - where growth was initially reported at close to 2% in each quarter. (To be fair, some of that was genuine, as the border was starting to reopen at that point.) Finally, the last two quarters have been small negatives.
It’s even more apparent when you look at the relevant component of GDP, exports of services. The seasonally adjusted series shows double-digit rises and falls that simpky didn’t happen - we know that tourist numbers were zero and holding there.
Stats NZ essentially froze the seasonal adjustment program in March 2020, instead applying the pre-Covid seasonal factors to the data. In the last few quarters they’ve begun to ‘thaw’ the program, and are now recalculating new seasonal factors at every GDP release. As the chart above shows, we’re already seeing the effects: the June and September 2022 quarters have each been revised down to around 1.5% growth from 2% previously, while the negative results in December 2020 and March 2022 have basically disappeared.
It’s a reasonable guess that these revisions will continue in the same direction for a little longer, meaning that June quarters (like this week’s release) will remain on the high side. But it’s also possible that the seasonal factors could adjust quicker than I’m giving them credit for. In that case, maybe we won’t see a boomer this week, but some of that growth will instead be shifted into the two previous quarters.
What should we make of that - were the previous GDP reports wrong? It’s not that simple. We need to remember that seasonal adjustment doesn’t give us “the truth”, it’s just a way of helping us interpret the truth. The economy really does slow down in winter, and we really do need a way of looking through that. But the last few years have been unusual to put it mildly, and we’re finding the limits of what statistical techniques can do.
One way to get around this whole issue is to look at the annual growth rate, which isn’t affected by seasonal adjustment. All of the forecasts suggest something lower than the previous 2.2% reading (which would probably leave it slightly negative once you strip out population growth). So it’s an economy that is losing momentum, but not dramatically so. And whether it has slowed enough to knock inflation on the head is still yet to be determined.