Labour market trends redux
Labour market trends redux
A selection of findings from the Household Labour Force Survey.

I’m aware that it’s been a bit slow on the blog lately. There’s a harmless enough reason: we’re in the process of buying and selling houses, so I’ve had other things on my mind outside of work time. And while the housing market would be an obvious and easy topic to write about, I don’t feel like there’s much from our experience that could be generalised. Posting will remain light for another few weeks at least.
To keep things ticking over, I thought I’d revisit one of my earliest pieces, which looked at some of the developing trends in the labour market, beyond the headlines from the day of the data release. Nine months on, the softening in the jobs market has clearly gathered pace, and while an unemployment rate of 4.3% isn’t that bad compared to history, it’s a meaningful rise from the lows we saw two years ago.
Here I’ve updated some of the charts from that earlier post, as well as adding a couple of new ones. Last time I focused on whether there had been any structural changes in the labour market; this time the focus is more on the cyclical side.
1. People are ending up in unemployment for a range of reasons.
The number of people unemployed (defined as out of work but actively seeking) rose to 144,000 in the March quarter this year, up from 110,000 the same time last year. Given the slowing economy, a large share of this has naturally come from people being laid off, or temporary contracts not being renewed. People who have moved away from their old jobs are also finding it harder to get into a new one.
But there’s also been a sharp rise in people moving into education or training, reaching a record high in the March quarter. As I noted in my review on the day, this is an echo of the trends in migration in the last few years. During the Covid border closure, when demand was running hot but migrant workers were unavailable, businesses resorted to bringing young people (including schoolkids) into the workforce. Once the border reopened, this went into reverse. And as I showed, the rise in unemployment to date has been notably concentrated among 15-24 year olds. (The rise in the ‘never worked’ category in the chart below will likely include recent school leavers.)
I make no conclusions about whether this has been a good or a bad thing - youth unemployment is notoriously high, but if work has been coming at the expense of schooling, that’s not really desirable either.
Worryingly, there’s also been a sharp rise in the number of people out of work because of illness or injury, also reaching a record high this quarter.

2. Still no lift in the number of people working multiple jobs.
In both the US and Australia it’s been reported that a growing number of people are having to work more than one job to make ends meet. This was the issue that prompted my earlier post, showing that there was no such trend in New Zealand despite similar pressures on households. Nothing has changed since then.
In any case, I’m somewhat sceptical of this as a measure of household stress. It’s one thing to want a second income, but employers need to be offering those jobs, and in a slowing economy, that’s likely to be the deciding factor. A better indicator would be the number of people saying that they’d like to work more hours if they could, which has indeed picked up.

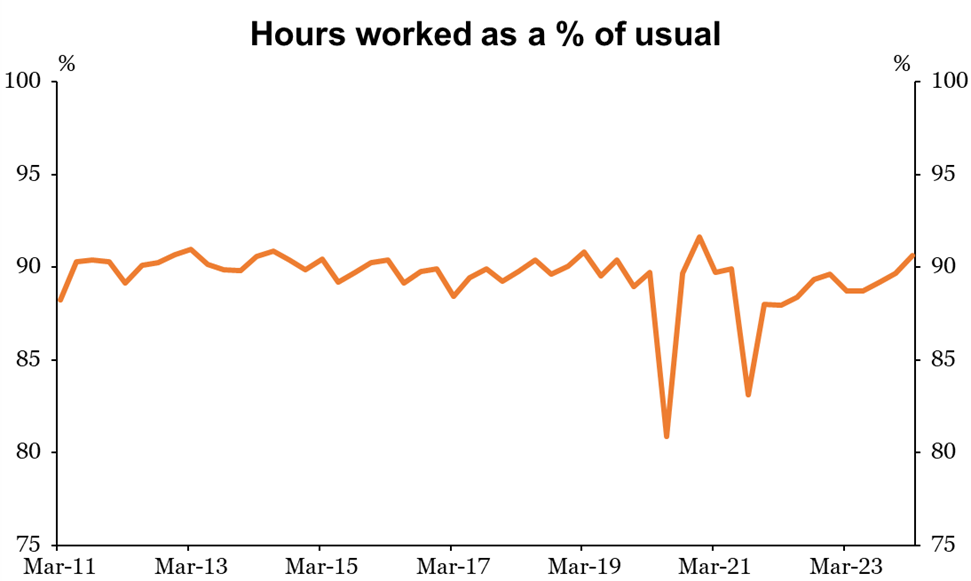
3. We’re back to normal working hours.
Typically we work around 90% of the ‘normal’ hours for our roles, after accounting for holidays, sickness and other factors. Last time I noted that this seemed to have dropped since Covid became widespread. Not hugely so, maybe only down by a percentage point. But that would equate to a 1% drop in our potential output, which in that context is a fairly large difference.
That seems to have come to an end though, and we’re back to working around 90% of our usual hours. This measure hasn’t historically followed the economic cycle, so the answer here is probably that there was less of a structural change than thought - unfortunately people may have become complacent again about bringing infectious diseases into the workplace.
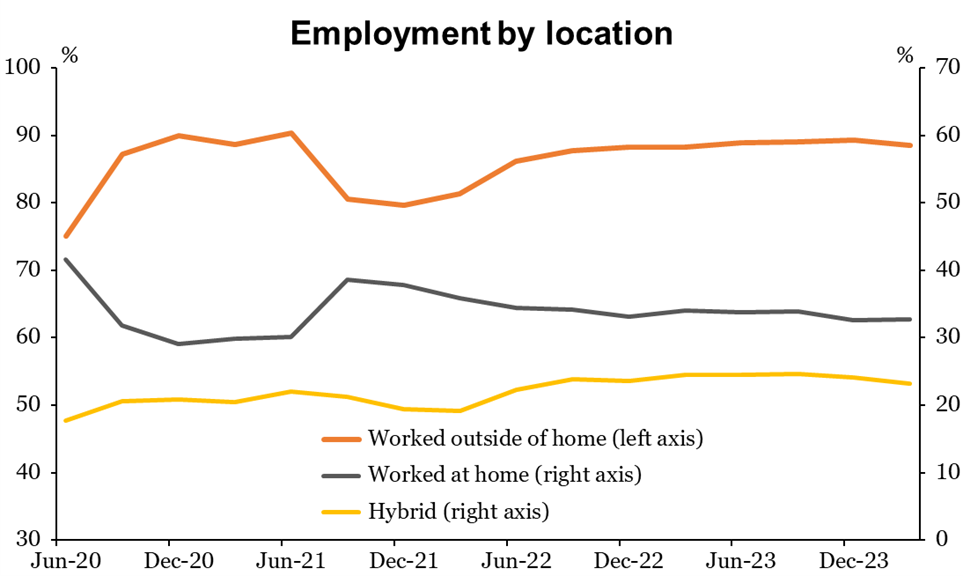
4. Working from home has lost ground, slightly.
Somewhat related to that, I noted last time that there seemed to have been a small but enduring move towards hybrid working. That has backtracked a little in the last year - the share of people coming into the workplace is up slightly, while the share working from home is down. The implication from these shares (remembering that they can add to more than 100%) is that hybrid working has declined, though it’s still more common than it was when we came out of the 2020 lockdown. This question was only added to the survey once Covid hit, so we don’t know what it looked like before then.
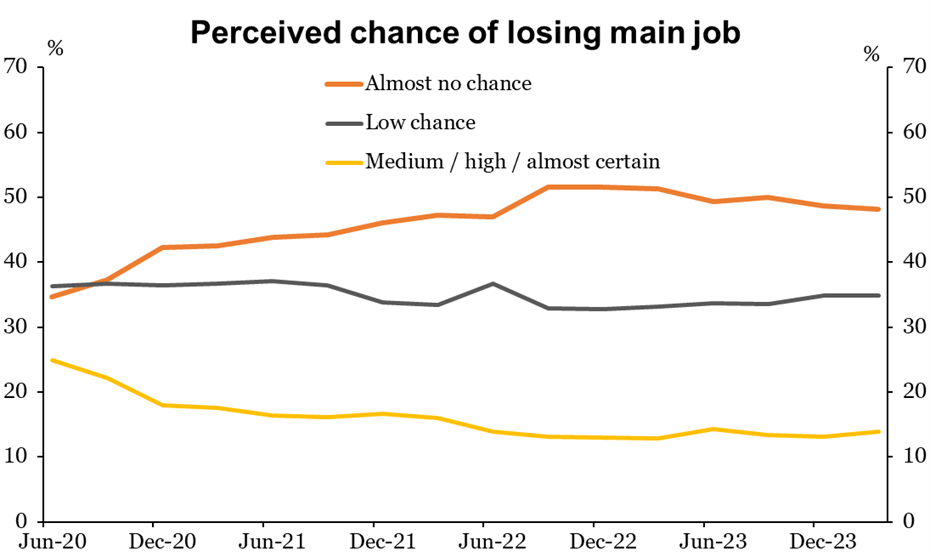
5. Job insecurity is notably low.
This is another question that was only added to the survey in 2020, so we don’t have much history to compare it with. But despite the souring news on the economy, most workers aren’t terribly worried about losing their jobs. There’s been a similar message from the Westpac McDermott Miller employment confidence survey, though that’s been quite choppy from quarter to quarter (and actually improved a lot in the March quarter).
The HLFS measure also showed that 99% of workers were in the same job as they were since the last survey - or in other words, only 1% of them had changed jobs. That compares to a high of 1.7% in the survey two years ago. In a relative sense, that’s a big change; reduced churn is another sign of a softer jobs market. People may feel confident about keeping their current jobs, but finding a new one is another matter.