Labour market trends
A selection of charts that typically don’t make the headlines.

Last week I caught an interesting chart from Australian economist Justin Fabo:
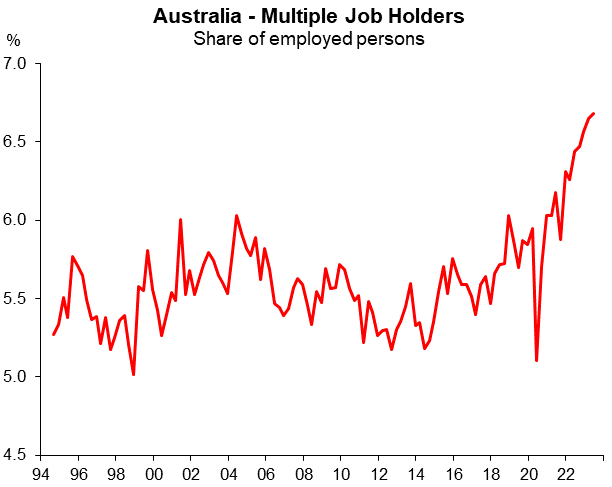
The share of Australians who are working more than one job has risen to record highs over the last couple of years. That’s been at a time when households have been under increasing financial pressure from the rising cost of living and higher mortgage rates.
But here’s the same chart for New Zealand:
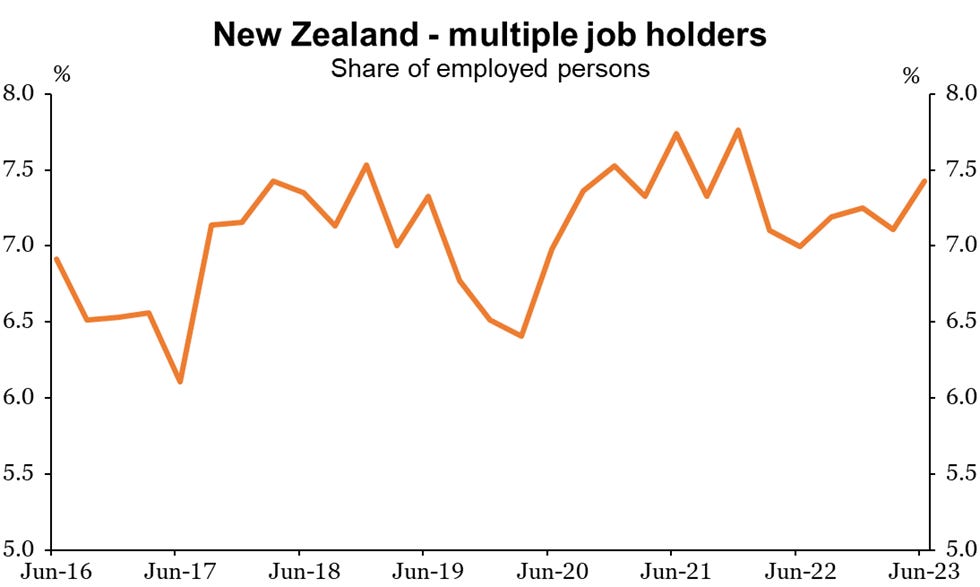
Hmm, no obvious trend there. If anything it’s eased off in the last year or so.
To the extent that there has been an increase in people working multiple jobs, it’s been among people working for themselves rather than for others. And indeed, second jobs are more common among managerial and professional types than for, say, labourers or retail workers. So in New Zealand at least, it seems to be motivated more by the entrepreneurial spirit than the need to pay the bills.

That’s not to deny that some households are feeling the financial pinch. Rather, this may have manifested in other ways: teenagers made up a large share of the growth in employment over 2022 in particular. But it’s curious that two quite similar countries would have such different responses to the same pressures.
This got me thinking as to what other trends may or may not have been developing in recent time. The Household Labour Force Survey has a wealth of questions that probably don’t warrant much attention from one quarter to the next, but they can be used to identify changes in the structure of the labour market over time.
Unfortunately, most of the questions I’ve covered here don’t have a long history, as they were only added to the survey during the last major revamp in 2016. But they can at least shed some light on recent developments, particularly since Covid.
Firstly, there’s what you could call worker insecurity. Are we seeing the rise of the gig economy, with people increasingly hired on limited terms, without the stability and benefits that come with a permanent position? The answer is no. Over 90% of workers are on permanent contracts, and that share has been gradually rising over recent years. (Similarly, and probably related, the share of people working part-time has been pretty consistently falling for the last decade.)

Next is bargaining arrangements. It’s a similar picture to the one above: a high majority of workers ae on individual agreements, and the share has been gradually rising. Collective agreements have been slowly declining, with no obvious lift in enthusiasm for them after Labour was elected in 2017. (The share of workers with no agreement at all has been falling, but it remains a little concerning given that this is, by my understanding, illegal.)

Next we’re on to Covid effects. For many years, the ratio of hours worked compared to people’s ‘normal’ hours was consistently around 90%. (This accounts for annual leave and sick leave, as well as things like reduced hours.) The impact of the Covid lockdowns is obvious, but what’s notable is that once we moved away from zero-Covid there was a sustained drop in average working hours – currently 88.7% of normal.
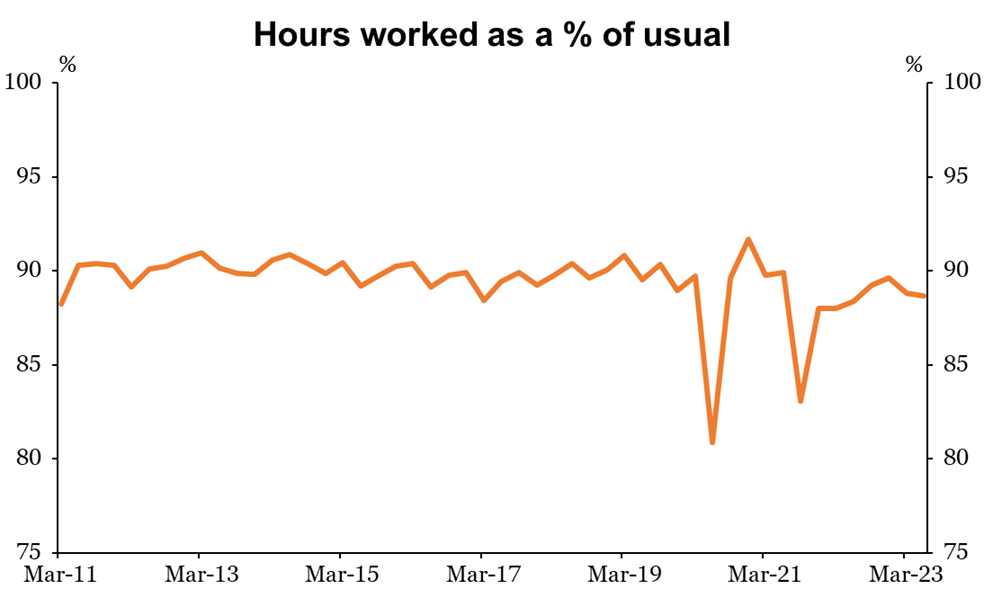
A 1% or so difference may not sound like a big deal, but bear in mind that when we talk about the ‘output gap’ – where the economy is running relative to its non-inflationary potential – we’re typically talking in increments of this size. Policy settings that tried to maintain the pre-Covid level of activity in the economy, without accounting for reduced worker availability, would lead to overheating and inflation.
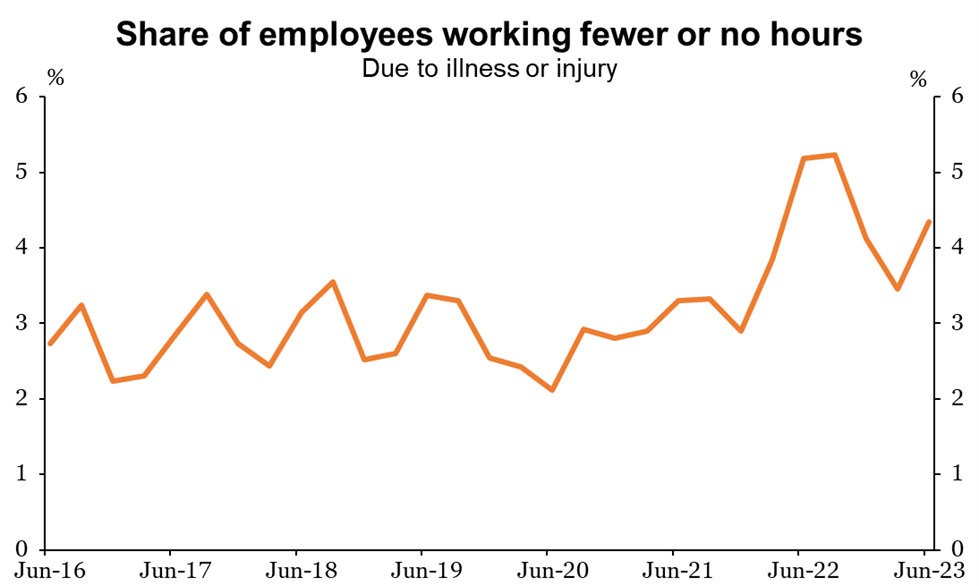
The HLFS includes a question on people’s reasons for working fewer or no hours, and the big shift in recent times has been because of their own illness or injury. (Note that there is a separate option for absences for ‘Covid-related reasons’, but this largely covered things like lockdowns and isolation requirements.) The spike in absences due to illness was in 2022, as Omicron swept through the country. But it has remained higher than normal since. That may well be due to ongoing Covid infections, although I’d like to think that people are also being a bit smarter about not bringing the flu into the workplace.
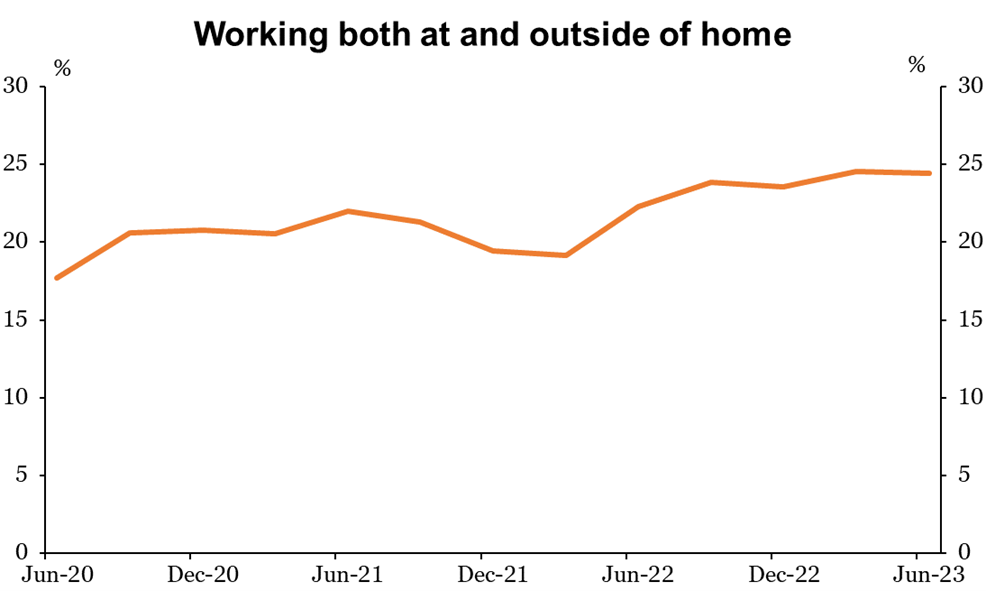
Finally, trends in working from home. This question was only added to the survey in response to Covid, so we don’t know what it looked like before 2020. But we can see clear shifts during the major lockdowns (the June 2020 and September 2021 quarters), followed by a gradual reversal. By the latest quarter, almost 90% of employees were back in the workplace, while about a third had worked from home at some point during the survey week.

Of course, people can give both responses (you’ll notice that the shares add up to more than 100%). So from these figures we can infer that about a quarter of workers had some sort of hybrid working arrangement, whether formal or informal.
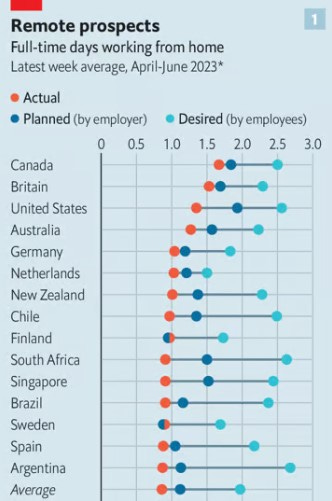
What’s interesting is that hybrid working still seems to be gaining in popularity. And it may have further to run: this recent chart from The Economist suggests that (1) working from home has caught on more in other English-speaking countries, and (2) what New Zealand workers are getting so far is well short of what they’d like to have. If that’s the case, employers are going to have to think seriously about how to make these sorts of arrangements part of their operating rhythm.